How to create Spire Commission Reports 1) Group, Filter and Total by Salesperson 2) Use Fixed or Variable Commission Rates to Calculate Commissions How to create Spire Sales Reports (14:10) 1) Report by Month, Quarter, Year etc. 2) Report by Sales, Costs, Gross Profit, GP%, Units Sold etc. 3) Graphical Analysis
General overview of the features and functions in Analytics For Spire. Examples of the Summary, Detail and Reporting Modules.

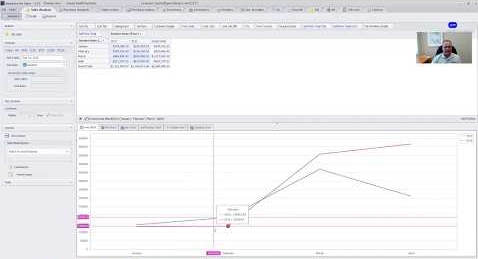
Business case example using Summary Reports and Visual Charts to Compare Sale Quantities to Inventory Received Quantities by Product Code

Examples of General Ledger (GL) Business Intelligence reports including Income Statement and Balance Sheet. How to compare Fiscal Year over Year data with auto Chart and Drill Down examples. Example of Gross Profit Analysis by Customer and Product Line

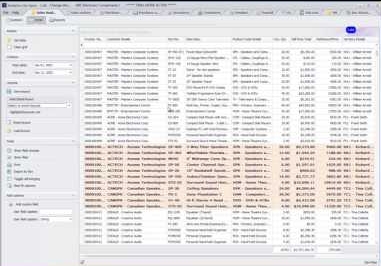
How to use Detail reports in Accounts Receivable along with Conditional Formatting and Custom Fields examples
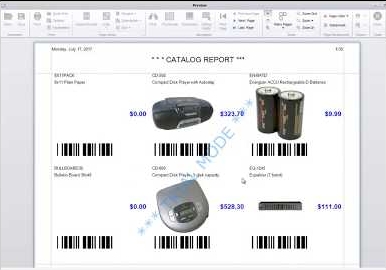
Inventory report examples using prefilters, filters and custom calculated fields. How to summarize inventory item quantities by warehouse. How to use the Report module with an overview of some included standard reports (Inventory Value, Reorder and Catalog reports). Example of how to modify and how to create quick reports.

Detail Grid view example of Invested Inventory using Custom Formulas and Conditional Formatting
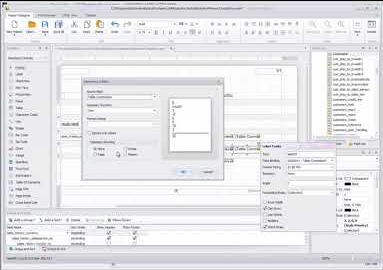
How to create a basic commission report using the new Reports module. Overview of Report Designer concepts including calculated fields, functions, formatting, totaling and grouping. Expression Editor overview
