Empower your team to create insightful reports, analyze data, and make timely and informed decisions.
Easy to use drag & drop analytical and reporting tool.

Easy to use drag & drop analytical and reporting tool.
Unleash the power of your most valuable asset:
Your Data
Dig deeper into your sales pipeline, track key sales and purchase metrics, forecast sales, plan inventory and optimize your business processes.

Installs with already useful report templates for fast, intuitive reporting.
Supports user defined fields (UDFs) and allows for the creation of an unlimited number of module-based, page formatted reports.
Access the data with SQL and create a view in Analytics, with full access to sorting, grouping, custom summaries and more.

Create comparative analyses by day, week, month, year, fiscal/calendar period
Make Sense of Your Critical Sales Data with Analytics for Spire.
Intuitive & Easy to Use.
No programming or technical knowledge required.
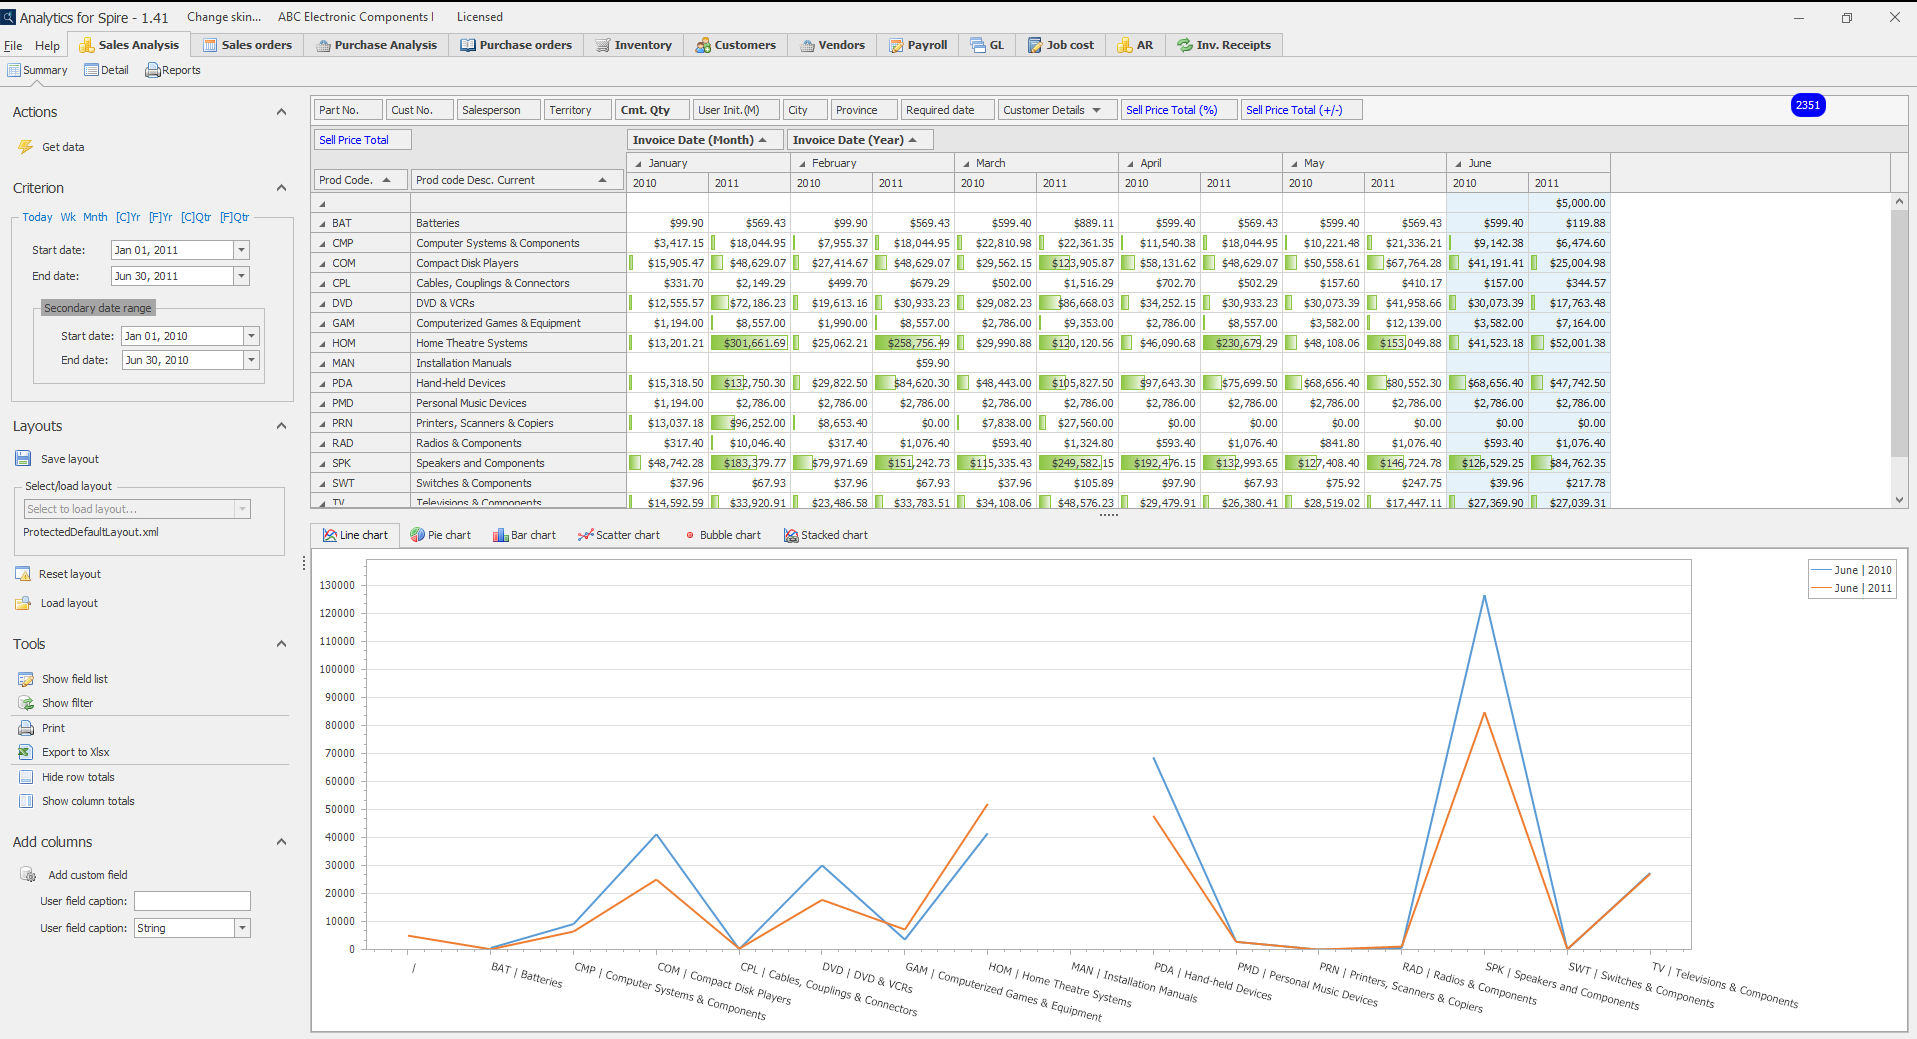
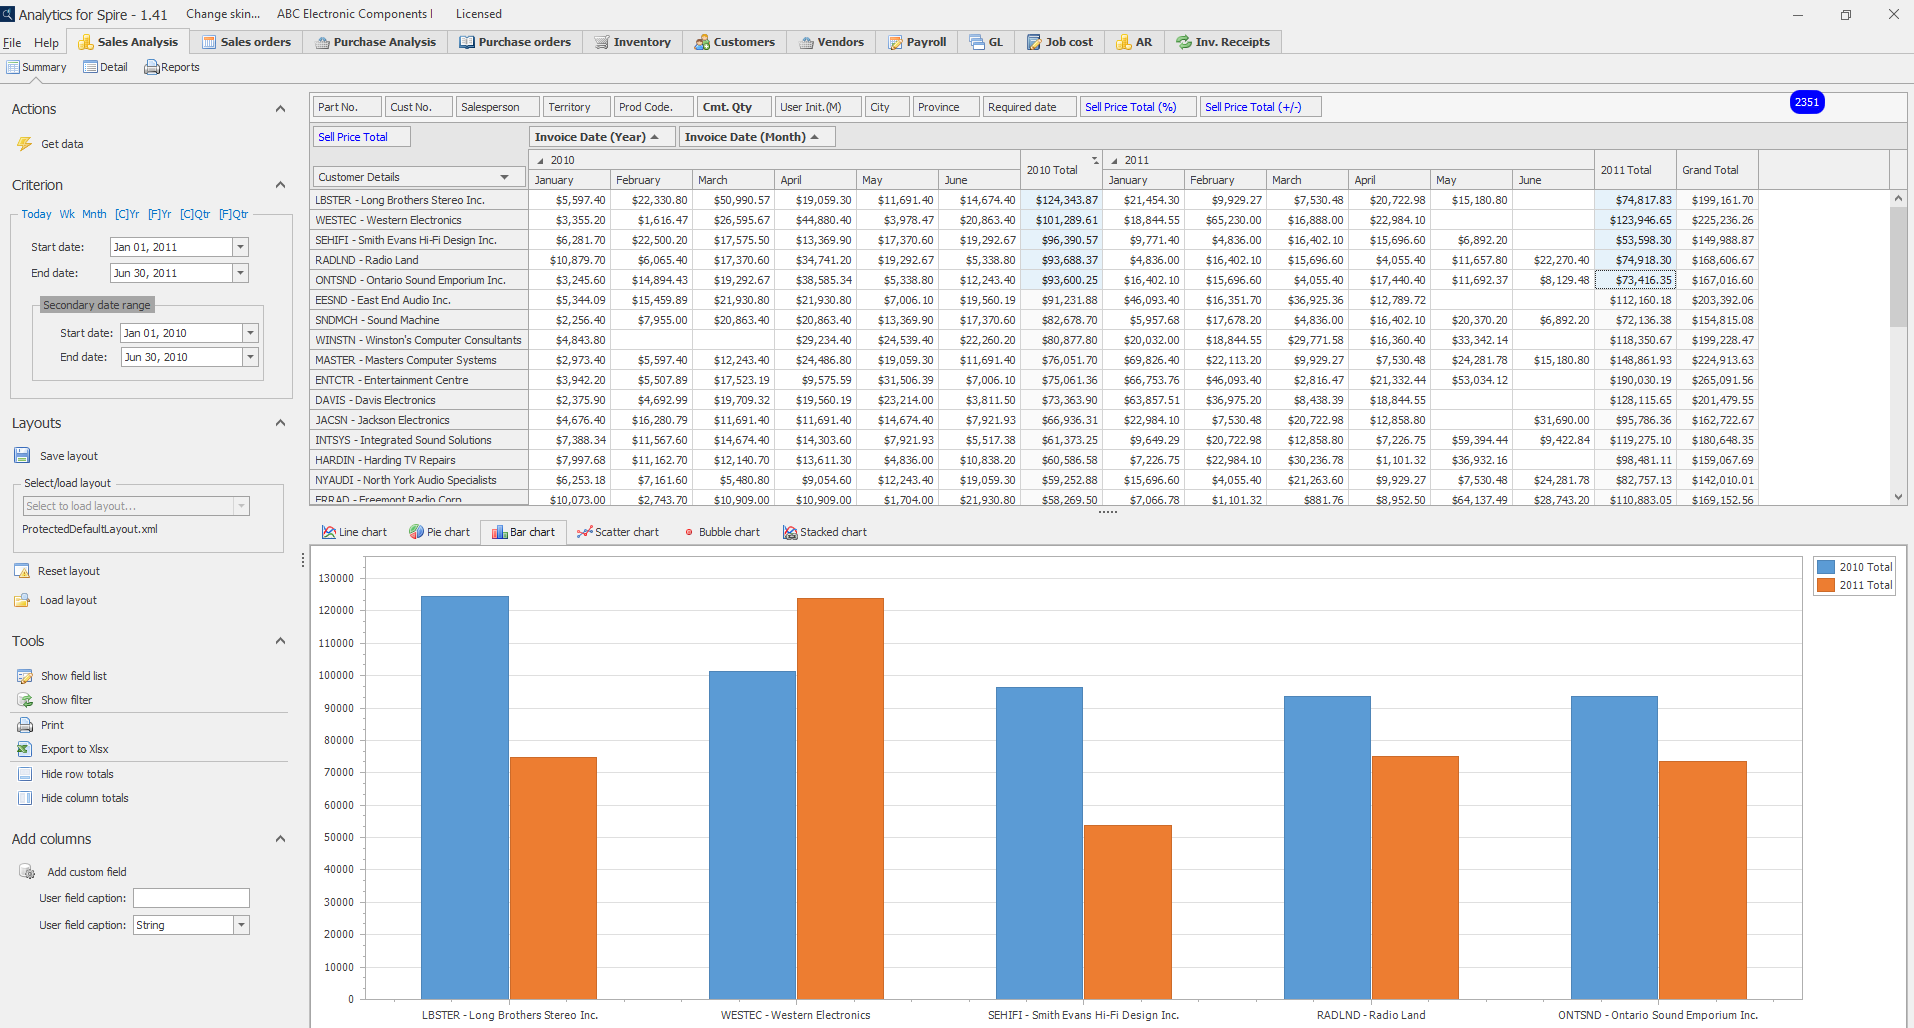
Sales Analysis
Sales Orders
Purchase Analysis
Purchase Orders
General Ledger
Inventory
Accounts Payable
Inventory Receipts
Customers
Vendors
Accounts Receivable
Job Costing
Payroll
Custom
Pivot Grid
Chart
Data Grid
Drill-Down
Cross-Tab
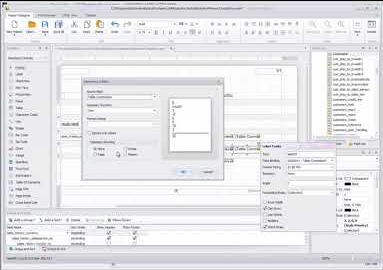
Report Designer
Top/Bottom
Conditional Formatting
Calculated Fields
Interactive Sorting
Grouping
Search
Filtering
Save Layouts
“This new version of the software is brilliant!”
How to create Spire Commission Reports 1) Group, Filter and Total by Salesperson 2) Use Fixed or Variable Commission Rates to Calculate Commissions How to create Spire Sales Reports (14:10) 1) Report by Month, Quarter, Year etc. 2) Report by Sales, Costs, Gross Profit, GP%, Units Sold etc. 3) Graphical Analysis
General overview of the features and functions in Analytics For Spire. Examples of the Summary, Detail and Reporting Modules.
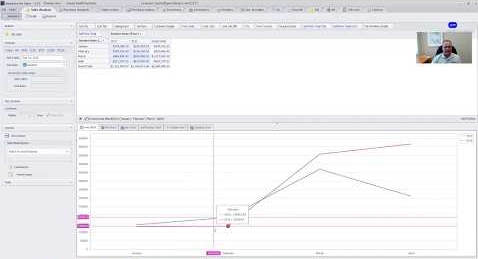
Business case example using Summary Reports and Visual Charts to Compare Sale Quantities to Inventory Received Quantities by Product Code
Examples of General Ledger (GL) Business Intelligence reports including Income Statement and Balance Sheet. How to compare Fiscal Year over Year data with auto Chart and Drill Down examples. Example of Gross Profit Analysis by Customer and Product Line
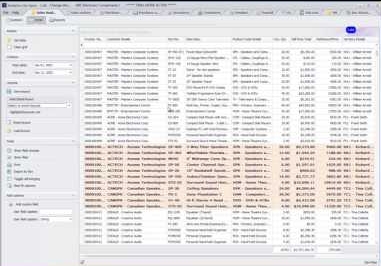
How to use Detail reports in Accounts Receivable along with Conditional Formatting and Custom Fields examples
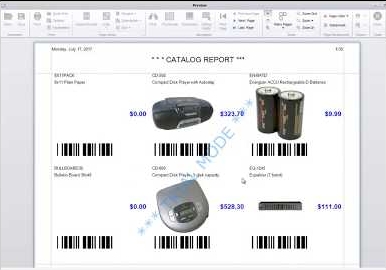
Inventory report examples using prefilters, filters and custom calculated fields. How to summarize inventory item quantities by warehouse. How to use the Report module with an overview of some included standard reports (Inventory Value, Reorder and Catalog reports). Example of how to modify and how to create quick reports.
Detail Grid view example of Invested Inventory using Custom Formulas and Conditional Formatting
How to create a basic commission report using the new Reports module. Overview of Report Designer concepts including calculated fields, functions, formatting, totaling and grouping. Expression Editor overview
Sign up for a free 30-day trial: